Output Data
The following datasets have been generated by IIASA during the Food Security DTE Precursor demonstration to help gather information that will allow the consortium to assess how much today’s technologies can meet the expectations of current and future stakeholders of the DTE.
The datasets can be downloaded here or viewed in the Food Systems DTE Portal.
Cropland Allocation Map
This dataset is a map of irrigated and rainfed maize areas; it serves the purposes of illustrative stress testing, which is a specific task in this project. It represents the output of the maize cultivated area minimization problem when maize is isolated from other crops.
The map is calculated based on the model setup modified from Folberth et al to isolate maize harvested areas and, additionally, requiring less land per simulation unit to be freed for environmental benefits (at least 10%). This is due to the fact that a higher environmental target makes the problem infeasible, as the global maize demand would not be satisfied. In terms of achievable land sparing, this setting provides overall reduction by 20% of rainfed and 15% of irrigated maize areas.
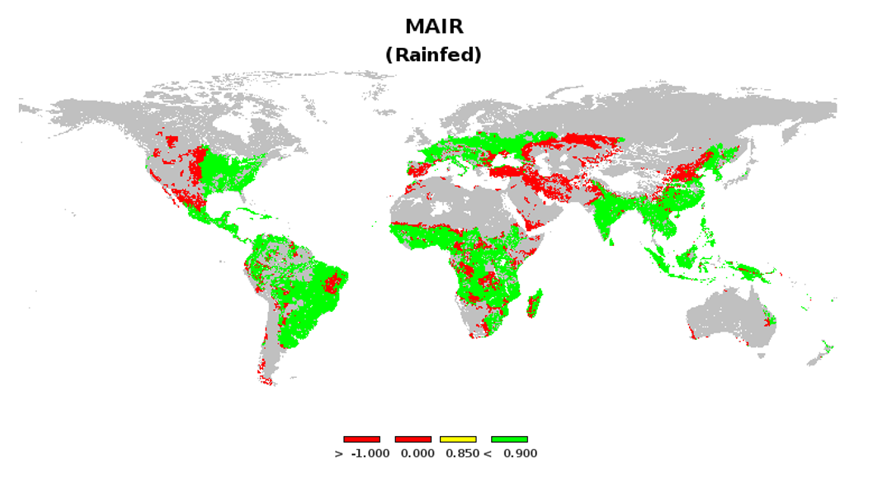
Maize production allocation (in the rainfed scenario) providing for maximum land sparing under constraints of this study. The color illustrates the share in a simulation unit (relative to initial allocation), so that green color denotes the used land, and red color depicts the land that is saved (through the land allocation optimization) and given back to nature.
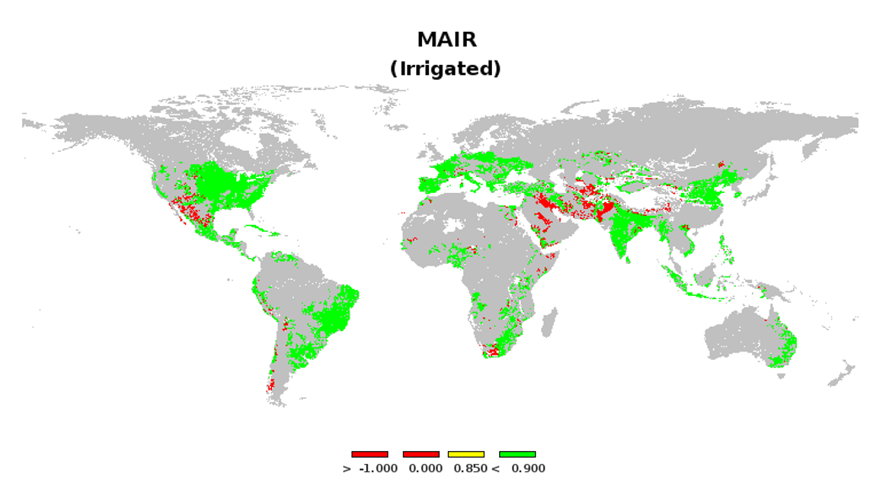
Maize production allocation (in the irrigated scenario) providing for maximum land sparing under constraints of this study. The color illustrates the share in a simulation unit (relative to initial allocation), so that green color denotes the used land, and red color depicts the land that is saved (through the land allocation optimization) and given back to nature.
Maize Annual Yield Potential
Maize annual yield potential expressed in “dry matter” t/ha/year units (YLDG) for 1990-2009 rainfed (RF) and irrigated (IR) as estimated by the EPIC model on optimized (maize-isolated) cropland mask produced for the project’s land allocation stress-testing.
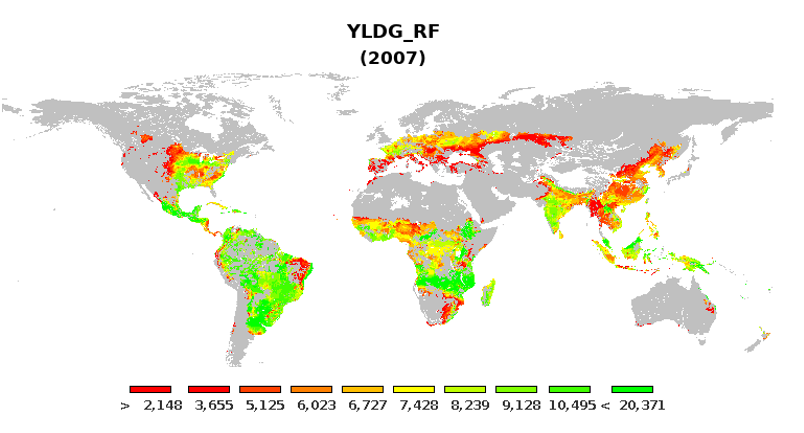
Maize yield potential (rainfed) as estimated by the EPIC model for the year 2007.
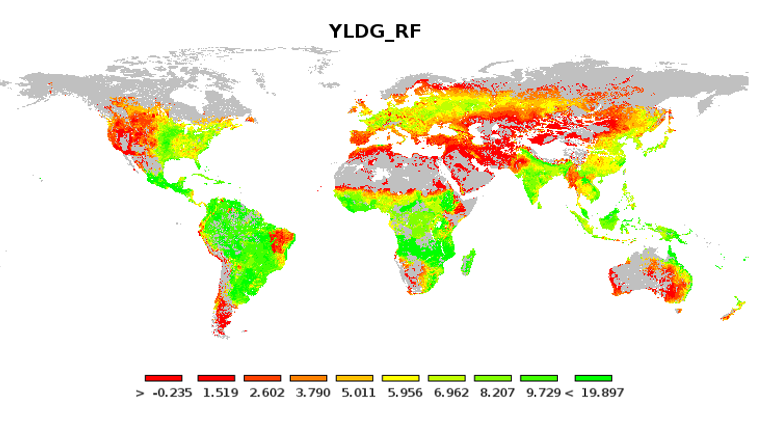
Maize Annual Yield Potential, driven by “annual climate” and estimated by AI/ML model
The maize annual yield potential expressed in “dry matter” t/ha/year units (YLDG) for the extreme year 2007 as estimated by the AI/ML model employing the “annual climate” features set and trained on 1990-2009 years (without 2007). Projections are provided for the whole cropland mask, not just the optimized land, as the entire mask was used for AI/ML training.
Maize yield potential (rainfed) as estimated by the AI/ML model using “alternative” precipitation dataset. Negative values should be interpreted as zero yield.